In the "Application" subsection, analytical reports are available that display data generated applications in the following sections: quantity and cost of applications. These reports are generated for the selected period in comparison with the previous one.
Applications
The Orders window displays the dynamics of the quantity (on the left) and cost (on the right) of generated orders.
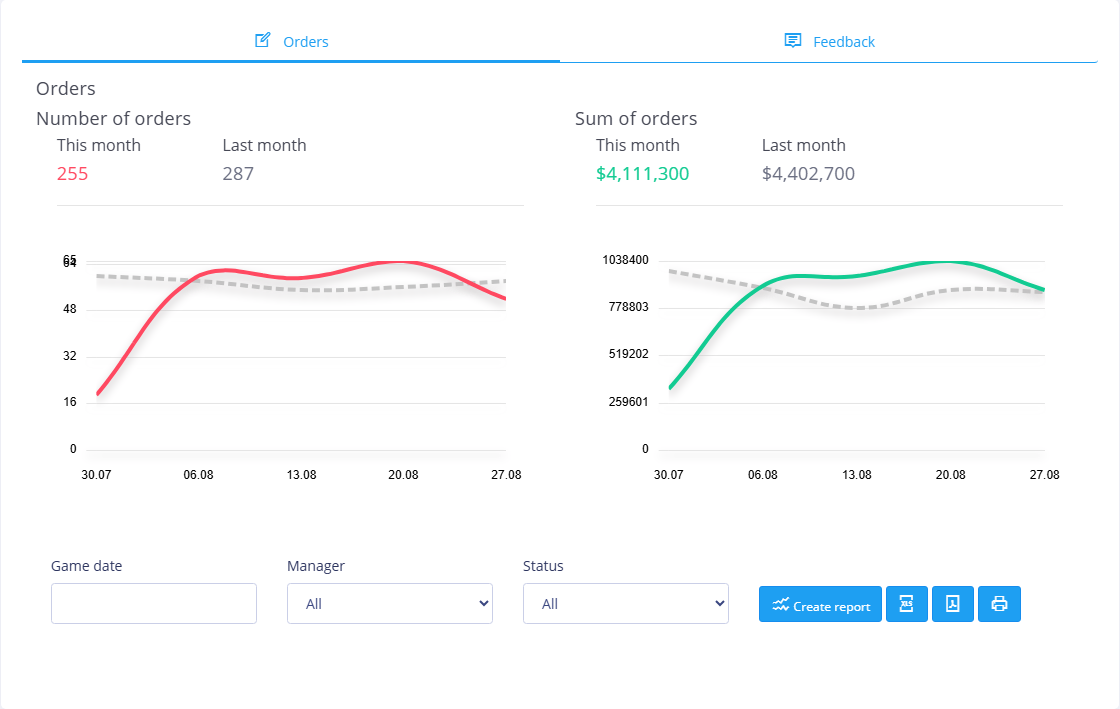
For ease of comparison, data from the previous reporting period is graphically presented as a dotted line.
Under the graphical display of orders there is a report settings panel:
- Game date - the reporting period is set manually from the keyboard (in the format dd.mm.yyyy) through a dash or selected from the drop-down calendar. If the Game date field is not filled in, the report is generated for the current month;
- Manager - user who registered the application;
- Status - application status. Using this field it is convenient to monitor, for example, the dynamics of unfinished requests in order to identify the reasons for their occurrence.
Once the report settings are configured, click the Create Report button to apply the changes.
After clicking the Create report button, a pivot table with a breakdown of the report data will be displayed at the bottom of the window. Click the Create report in XLSX format or Create report in PDF button to save the table in the appropriate format. To print the report data, click the  . This opens your browser's standard print settings window.
Reviews
In the Reviews window, a pie chart is formed with data on ratings in reviews left on the mini-site.
Under the graphical display there is a report settings panel:
- Created - the reporting period is set manually from the keyboard (in the format dd.mm.yyyy) through a dash or selected from the drop-down calendar. If the Created field is not filled in, the report is generated without a time limit;
- Instructor- the user specified in the application. Using this field it is convenient to track the personal rating of each instructor;
- Evaluation- evaluation in the application. This field is filled in from the keyboard with an integer from one to five. It is recommended to fill in the Rating field to receive a list of reviews with the selected rating.
Once the report options are configured, click the Create Report button to rearrange the chart data. After this, a summary table with a breakdown of the report data will also be displayed at the bottom of the window (all reviews on the basis of which the chart was generated are displayed in tabular form). Click the Create report in XLSX format or Create report in PDF format button to save the report data table in the appropriate format. To print the report data, click the . This opens your browser's standard print settings window.